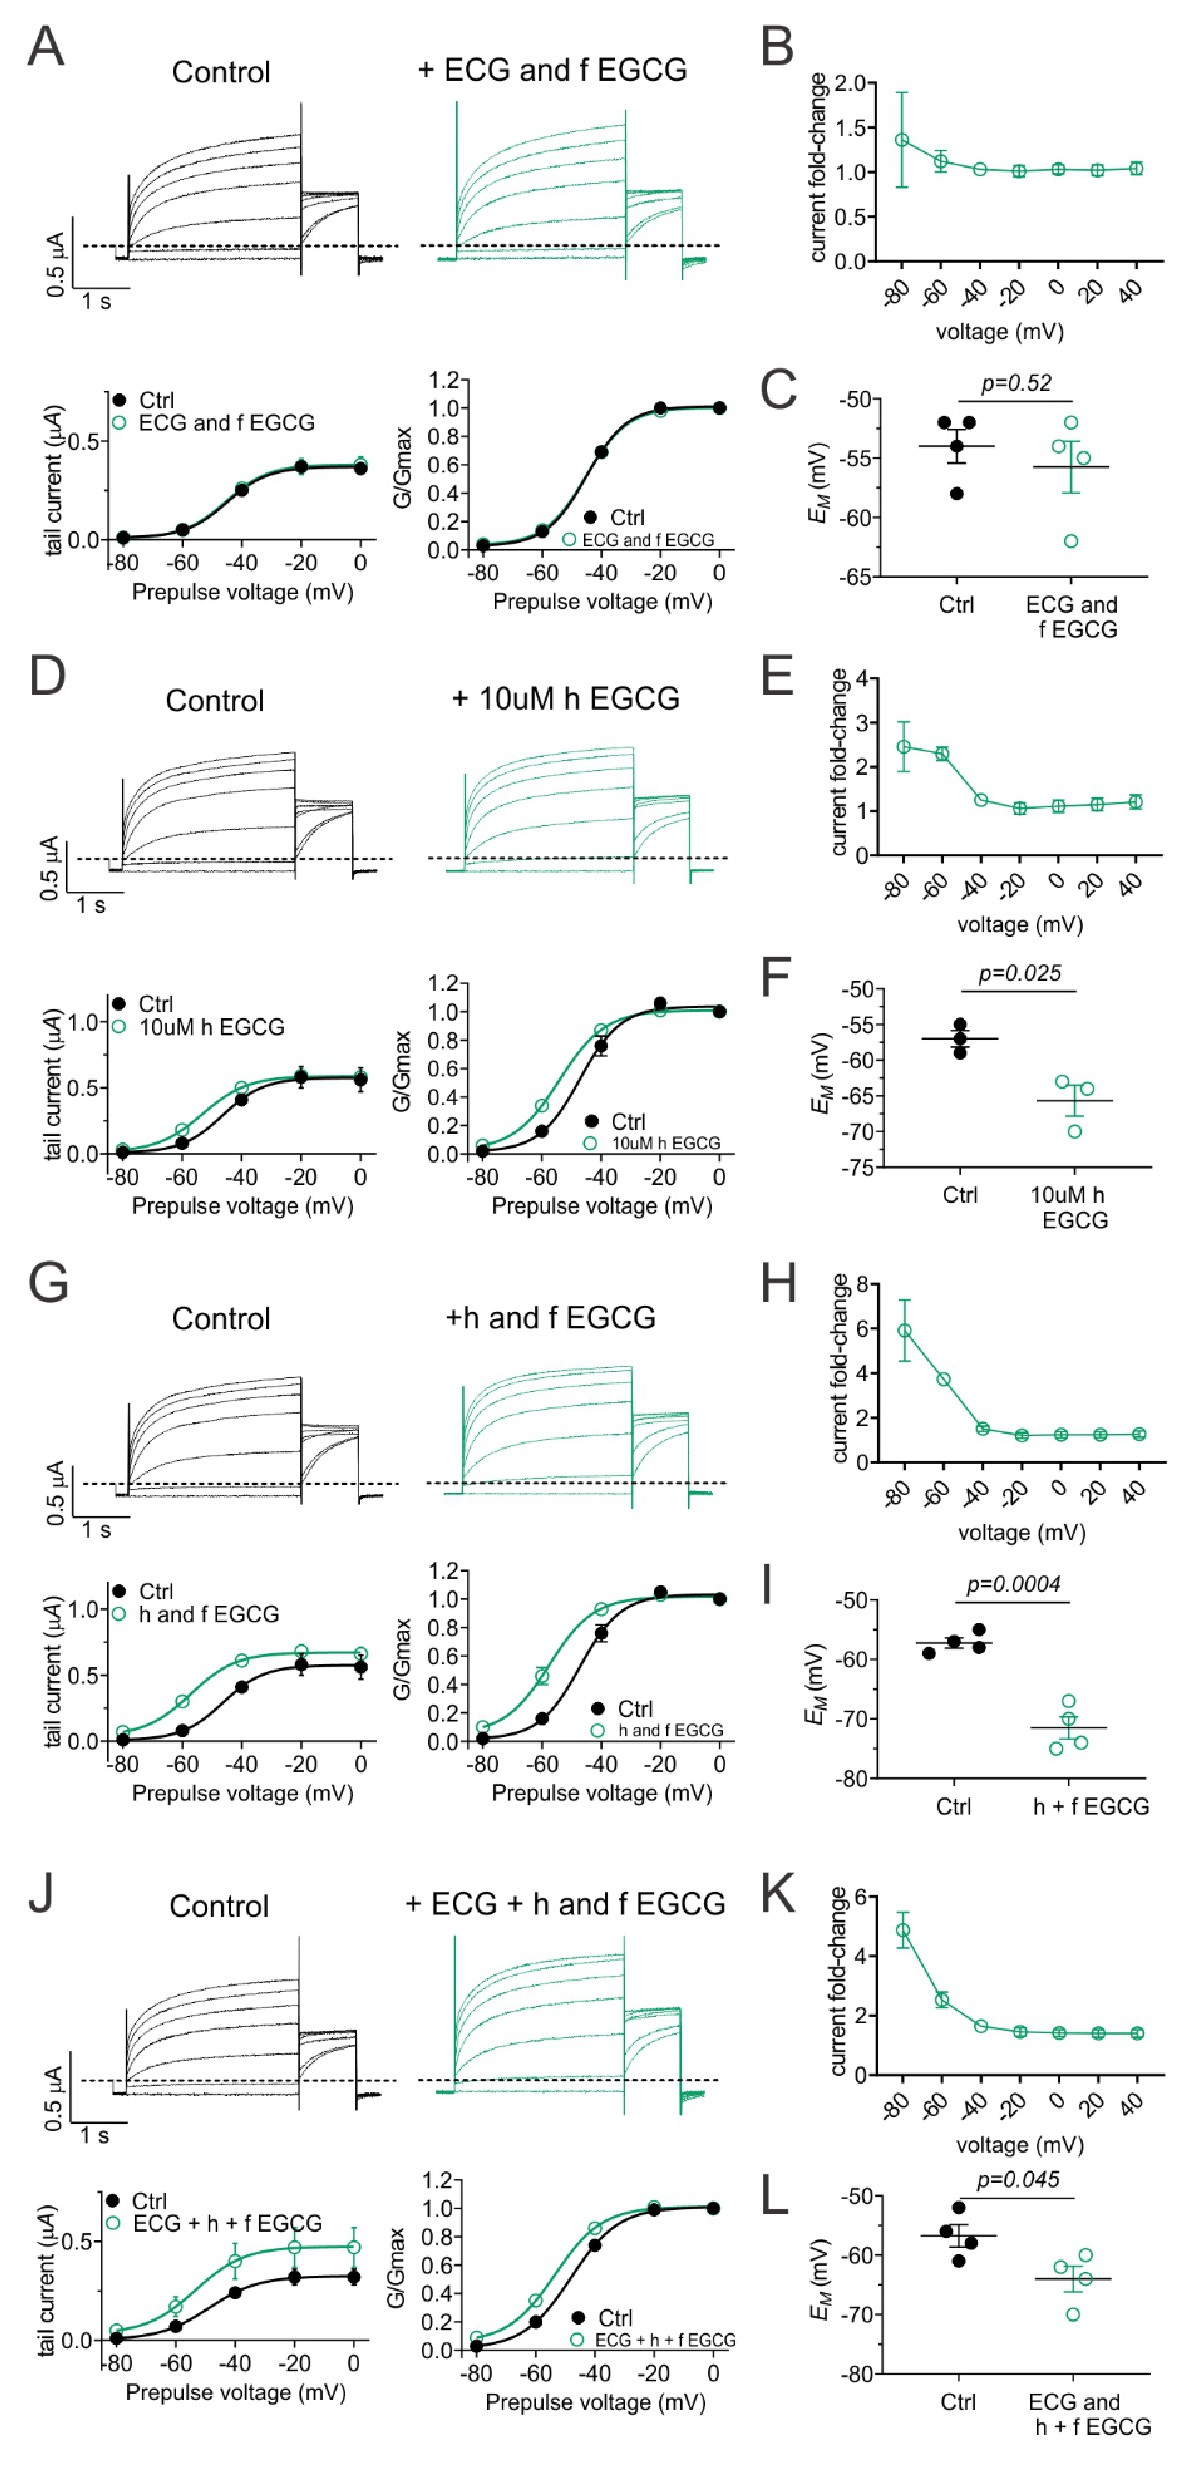
Fig. 10. Fresh and heated EGCG have additive effects on KCNQ5 activation. All error bars indicate SEM. A: Mean KCNQ5 traces, tail current and normalized tail current (G/Gmax) verses prepulse voltage in the absence (Control) and presence of ECG + fresh (f) EGCG (each 10 µM) (n = 4). B: KCNQ5 current fold-change versus voltage for traces as in D (n = 4). C: Scatter plot of unclamped membrane potential (EM) for cells as in D (n = 4). Statistical analyses by two-way ANOVA. D: Mean KCNQ5 traces, tail current and normalized tail current (G/Gmax) verses prepulse voltage in the absence (Control) and presence of 10 µM heated (h) ECG (n = 3). E: KCNQ5 current fold-change versus voltage for traces as in G (n = 3). F: Scatter plot of unclamped membrane potential (EM) for cells as in G (n = 3). Statistical analyses by two-way ANOVA. G: Mean KCNQ5 traces, tail current and normalized tail current (G/Gmax) verses prepulse voltage in the absence (Control) and presence of 10 µM each heated (h) + fresh (f) ECG (n = 3). H: KCNQ5 current fold-change versus voltage for traces as in J (n = 4). I: Scatter plot of unclamped membrane potential (EM) for cells as in J (n = 4). Statistical analyses by two-way ANOVA. J: Mean KCNQ5 traces, tail current and normalized tail current (G/Gmax) verses prepulse voltage in the absence (Control) and presence of 10 µM each ECG + heated (h) + fresh (f) ECG (n = 4). K: KCNQ5 current fold-change versus voltage for traces as in M (n = 4). L: Scatter plot of unclamped membrane potential (EM) for cells as in M (n = 4). Statistical analyses by two-way ANOVA.